Monthly Economic and Investment Outlook
October 2025 Economic and Investment Outlook
October 2025 Economic and Investment Outlook
Source: Bloomberg
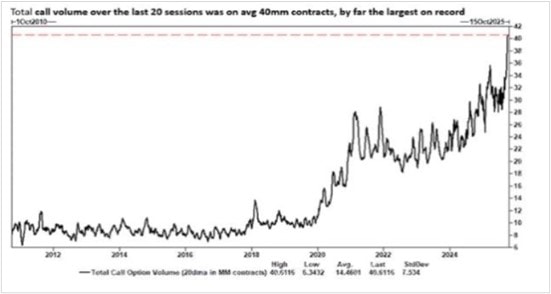
Call Options Largest on Record
Source: Bloomberg
Source: Strategas Research
Products and services offered through F.N.B. Wealth Management are not FDIC insured; and are not insured by any Federal Government Agency, are not deposits or obligations of or guaranteed by First National Bank of Pennsylvania or its affiliates and may go down in value.
This report is provided for informational purposes only. The report includes forward-looking statements and reflects the current opinions of the authors, which are subject to change without notice, as are the information and assumptions upon which they are based. Changes in market conditions, changes to applicable laws, and various other events may render the contents no longer reflective of our positions.
Information in this report is obtained from sources F.N.B. Wealth Management (FNBWM) believes to be reliable, but we cannot guarantee the accuracy, timeliness, or completeness of information obtained from third party sources. Charts and statistics included throughout then report are for illustrative purposes only and do not represent any portfolio FNBWM manages. Indices are not available for direct investment, and index performance does not reflect the expenses or management fees associated with investing in securities. Investing involves risk and past performance is not a guarantee of future results, and there can be no assurance that any action taken based upon the information referenced in this report will be profitable, equal any historical performance, or be suitable for your portfolio or individual situation.
Tactical Fixed Income and Tactical Equity Allocations in this report reflect FNBWM’s broad positioning for each asset class and are provided for informational purposes only. The inclusion of these allocations does not constitute an offer to buy or sell, nor a recommendation to buy or sell, any security or financial instrument or take any particular action. Neither these allocations nor any other information presented within this report constitute personalized investment advice, and the report’s authors do not account for the financial situation or specific needs of any individual in preparing the report. You are encouraged consult with your investment advisor regarding its applicability to your individual situation.
F.N.B. Wealth Management refers to F.N.B. Investment Advisors, Inc. and First National Trust Company, which are subsidiaries of First National Bank of Pennsylvania (FNBPA) and F.N.B. Corporation (FNB). Accounts and services offered through F.N.B. Wealth Management are not FDIC insured or insured by any Federal Government Agency and are not deposits or obligations of or otherwise guaranteed by FNBPA or any FNB affiliate and may lose value.